Time Travel Debugging (Windows)
Time travel debugging (TTD) allows you to record an execution trace of a program or system and replay it back and forth. It can speed up the process of reverse engineering/vulnerability research, and deal with certain tasks that are not easy to handle in regular forward debugging.
Several tools implement TTD. On Windows, Binary Ninja debugger integrates with the WinDbg/DbgEng TTD so that you can replay and analyze a trace recorded by WinDbg. The combination of TTD and your familiar reverse engineering tool would hopefully supercharge the ability to time travel and make your workflow even more effective.
Below is a guide to set it up.
Install WinDbg
There are two ways to install and configure WinDbg to be used by Binary Ninja debugger. We recommend you to try the first method first. If it does not work, for example if your machine cannot connect to the Internet, you can follow the second method to set it up manually.
The WinDbg installation only needs to be done once.
Install WinDbg Automatically
- Open Binary Ninja
- Click
Debugger->Install WinDbg/TTDfrom the menu - A dialog will appear showing the installation progress:
- The installer automatically downloads the latest WinDbg from Microsoft
- It extracts the necessary files (DbgEng DLLs and TTD components)
- WinDbg will be installed to
%APPDATA%\Binary Ninja\windbg - Progress and status are displayed in real-time
- Wait for the installation to complete
- Restart Binary Ninja
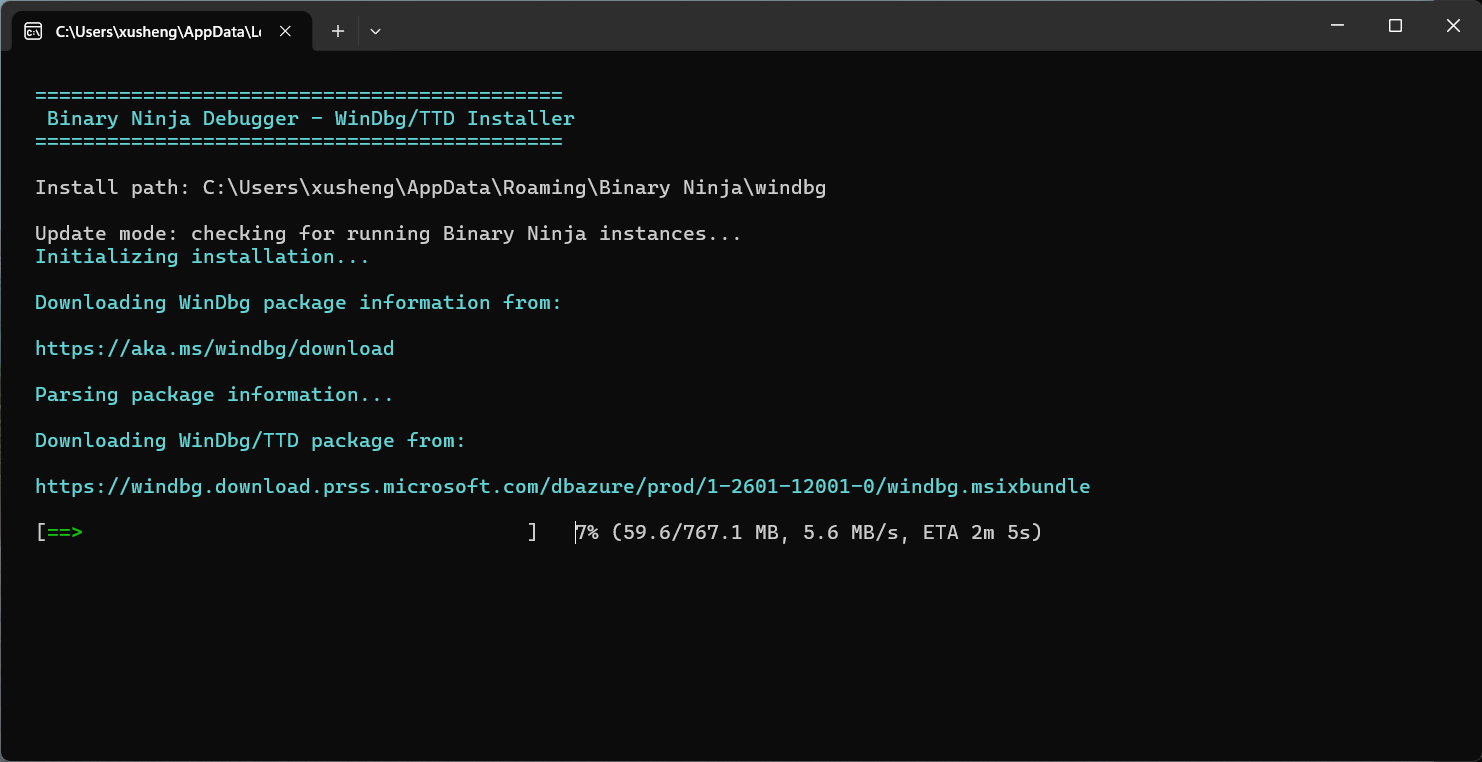
The automatic installer handles all the complexity of downloading and extracting the WinDbg MSIX bundle.
Update WinDbg/TTD
If you already have WinDbg/TTD installed and want to check for updates:
- Click
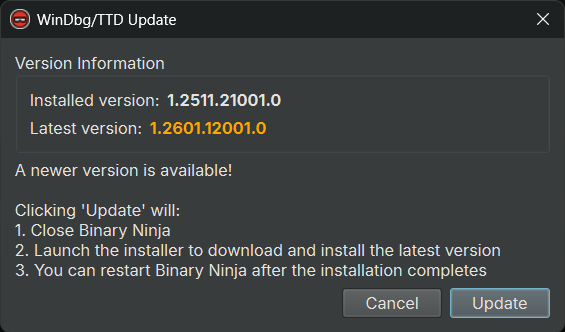
Debugger->Install WinDbg/TTDfrom the menu - A dialog will appear showing:
- The currently installed version
- The latest available version from Microsoft
- If a newer version is available, click "Update" to download and install it
- If you are already on the latest version, the dialog will indicate that no update is needed
- Restart Binary Ninja after updating
Install WinDbg Manually
- Download https://aka.ms/windbg/download
- Open the downloaded AppInstaller file in a text editor. It is an XML file, and look for the download URL of the WinDbg MSIX bundle in it
- The download URL should look like https://windbg.download.prss.microsoft.com/dbazure/prod/1-2402-24001-0/windbg.msixbundle
- Download the MSIX bundle using the URL found in the above step (this can take a while to finish)
- The downloaded MSIX bundle is a Zip archive. Extract it with a tool like 7Zip
- Find the
windbg_win-x64.msixfile in it. This is also a Zip archive, extract it - Find the path of the DbgEng DLLs you have extracted
- It should be inside the
amd64folder of where you extracted thewindbg_win-x64.msix - For example, it can be
C:\Users\XXXXX\Downloads\windbg\windbg_win-x64\amd64 - There should be an x64 version of
dbgeng.dllin it
- It should be inside the
- In Binary Ninja, open the Settings view via the menu
Edit->Settings, or use the shortcut (Ctrl+,) - Search for
debugger.x64dbgEngPath, and set it to the folder that the DbgEng DLL is in from the previous step (do NOT include the DLL itself in the path!) - Restart Binary Ninja
Record a TTD Trace
Once we have installed and configured WinDbg, we can start recording a TTD trace. There are multiple ways to do it:
- Launch and record: Start a new process and record it from within Binary Ninja
- Attach and record: Attach to a running process and record it from within Binary Ninja
- Record in WinDbg: Use WinDbg directly for more advanced recording options
Record a TTD Trace in Binary Ninja
- Make sure you have WinDbg properly installed and configured
- Open the file you wish to trace in Binary Ninja (optional)
- Click
Debugger->Record TTD Tracefrom the menu
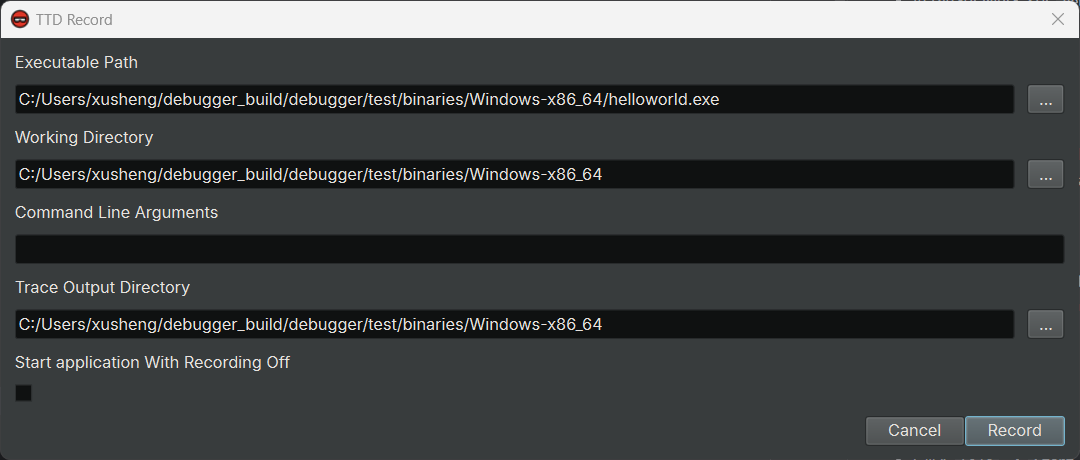
- In the "TTD Record" dialog, configure the recording as you wish:
- Executable Path: the path of the executable to trace
- Working Directory: the working directory to launch the executable in
- Command Line Arguments: the command line arguments to pass to the executable
- Trace Output Directory: the directory to write the trace. By default, it is equal to the working directory, but can be changed if necessary
- Start Application With Recording Off: if checked, starts the application with tracing disabled initially (useful for manual tracing control)
- Trace Child Processes: if checked, includes child processes spawned by the main process in the trace recording
- Click "Record". A UAC dialog will pop up because the TTD recording requires Administrator privilege
- Accept the elevation. The program will be launched and recorded. Once it exits, find the trace file in the trace output directory
Attach and Record TTD Trace
You can attach TTD to a running process to record its execution. This is useful when:
- The process is already running and you want to capture its behavior
- The process has complex startup requirements that are difficult to replicate via launch
- You want to record only a specific portion of the process's execution
To attach and record:
- Make sure you have WinDbg properly installed and configured
- Click
Debugger->TTD->Attach and Record TTD Tracefrom the menu
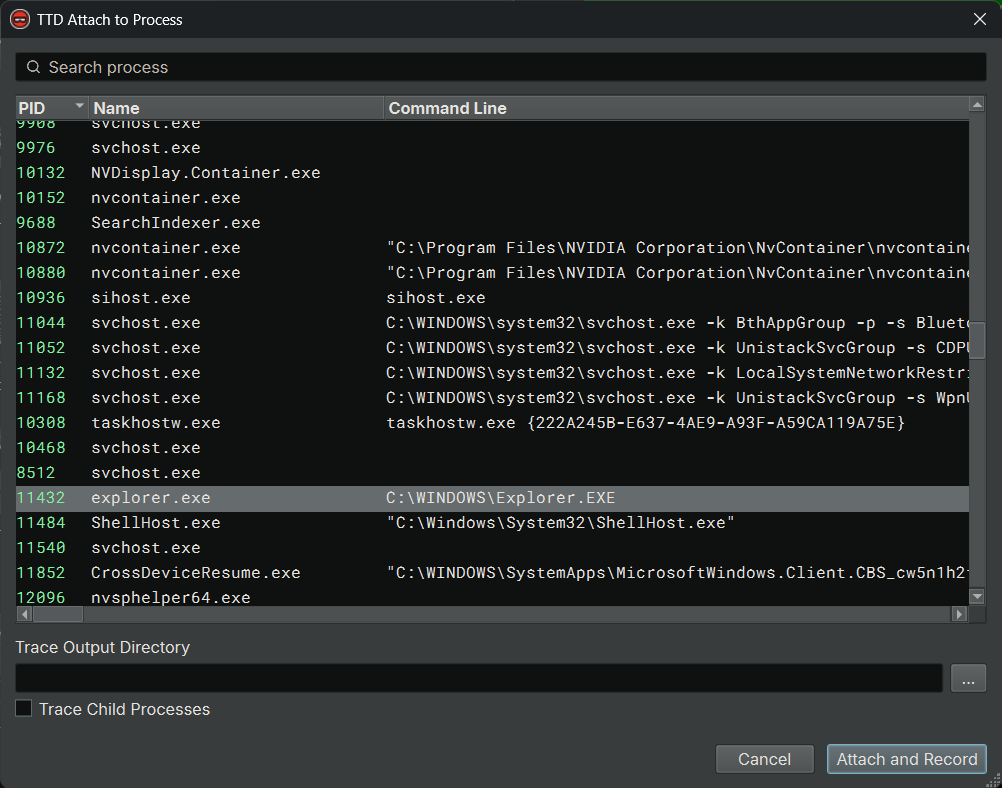
- In the "TTD Attach" dialog:
- A list of running processes is displayed with their PID, name, and command line
- Use the filter box to search for a specific process by name or PID
- Select the process you want to attach to
- Trace Output Directory: the directory to write the trace (defaults to your Documents folder)
- Trace Child Processes: if checked, includes child processes spawned by the target in the recording
- Click "Attach". A UAC dialog will pop up because TTD recording requires Administrator privilege
- Accept the elevation. TTD will attach to the process and begin recording
- Interact with the application as needed to capture the behavior you want to analyze
- When done, terminate the process or use the TTD controls to stop recording
- Find the trace file in the trace output directory
Record a TTD Trace in WinDbg
- Find
DbgX.Shell.exein the WinDbg installation, run it - Click
File->Start debugging->Launch Executable (advanced) - Select the executable file you wish to record
- Check
Record with Time Travel Debugging, and clickDebug - In the popup dialog, select a folder to save the recorded trace
- Wait for the process to exit, or click
Stop and Debugwhen appropriate - WinDbg then loads the trace and indexes it
- The index will make it faster to work with the trace
- Close WinDbg
- For other types of recording or the available options, please check out the official guide at https://learn.microsoft.com/en-us/windows-hardware/drivers/debugger/time-travel-debugging-record
Load the TTD Trace in Binary Ninja Debugger
- Open the .exe or .dll file in Binary Ninja
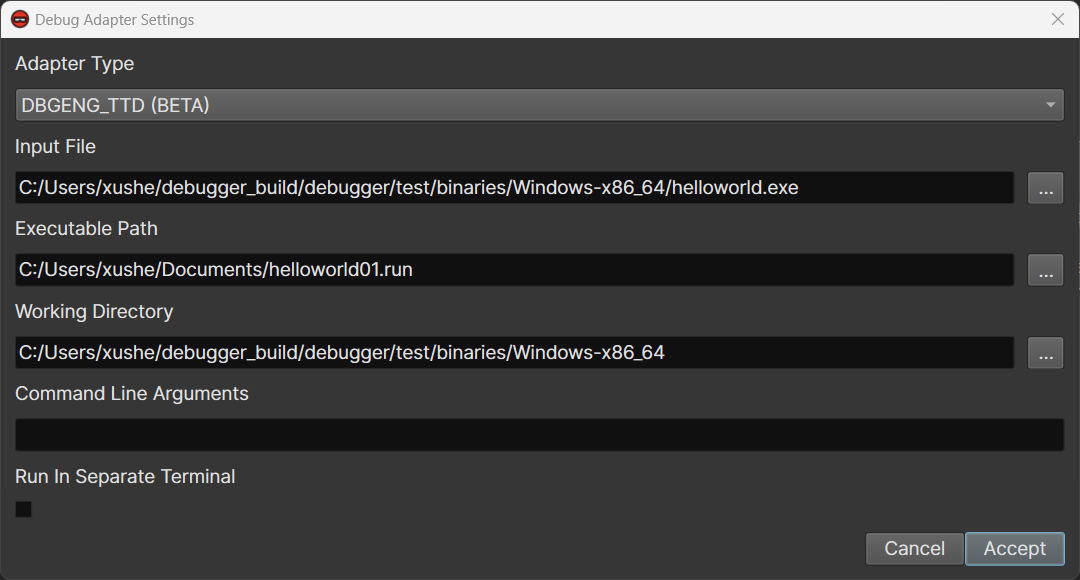
- Click
Debugger->Debug Adapter Settings - Select
DBGENG_TTDas the debug adapter - For
Trace Path, select the trace file recorded in the previous step- E.g.,
C:/Users/xushe/Documents/helloworld01.run
- E.g.,
- Click
Accept
Debug the TTD Trace
- Click
Launchto launch the target - Most of the debugger functionalities should work in the very same way as forward debugging
- The control buttons in the debugger sidebar widget shows four new buttons for reverse debugging on the right side:
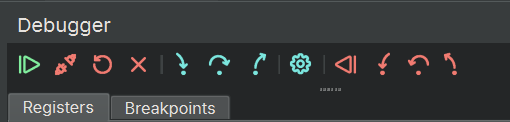
- These new buttons are in red color and flipped
- You can hover over the button to see what they do and the keybindings for them
- You can also control the target using commands in the debugger console. Use one of these commands:
- g-: go back
- p-: step over back
- t-: step into back
- g-u: step out back
- The !position command prints the
positionof all active threads - The !tt navigation command navigates to a specific
positionin the trace- E.g.,
!tt 1A0:12F - While using the debugger, when the target stops, the current position will be printed in the debugger console
- E.g.,
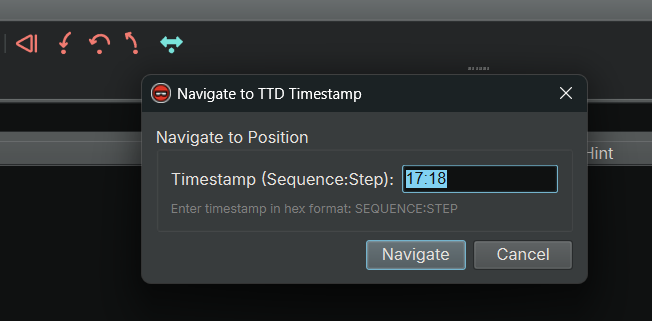
- There is a "Navigate To TTD Timestamp..." button in the debugger controls. When clicked, a dialog pops up showing the current TTD timestamp (position) and allows you to enter a new timestamp to navigate to. This provides a convenient way to jump to specific positions in the trace without using console commands.
- The !tt breakpoint command supports breaking the target when memory is read/written/executed, a register value is changed, or a module has been loaded, both in forward and backward directions. This is very powerful and worth checking out!
TTD Analysis Features
Binary Ninja's TTD integration includes powerful analysis widgets that leverage WinDbg's TTD.Calls and TTD.Memory queries to help you understand program behavior during the recorded trace.
TTD Calls Widget
The TTD Calls widget allows you to query and analyze function call events from your TTD trace. This is equivalent to WinDbg's dx @$cursession.TTD.Calls() functionality but integrated directly into Binary Ninja.
⚠️ Performance Warning
TTD queries execute synchronously and will block the Binary Ninja UI until they complete. For large traces or broad queries (e.g.,
*!*or wide address ranges), this can take considerable time. Due to a current WinDbg backend limitation, there is no way to interrupt a running query once started. Please ensure your queries are appropriately scoped to avoid long wait times.
Accessing TTD Calls
-
Open the TTD Calls sidebar:
- Click the TTD Calls button in the sidebar (hover over the icons to see its name)
- Note: The TTD sidebar icons are hidden when you are not actively debugging. They will appear in the sidebar when you start a TTD debugging session.
-
The widget appears in the right sidebar by default
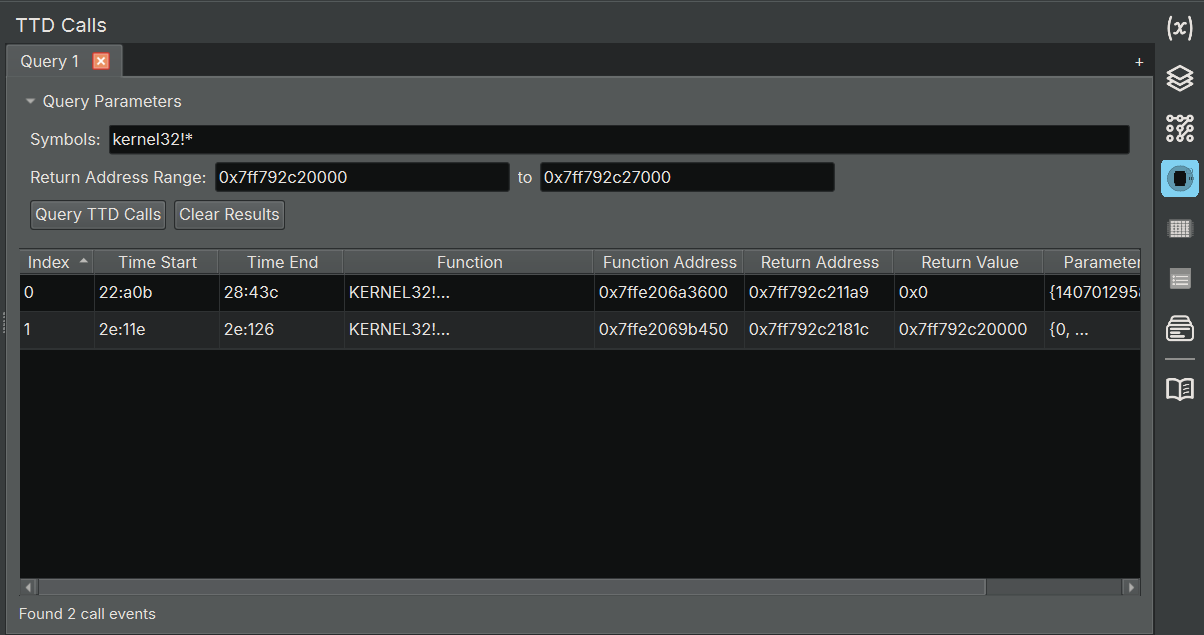
Using the TTD Calls Widget
Query Parameters:
-
Symbols: Enter function names or patterns to search for. Must include module name or use wildcards. You can use:
- Specific module and function:
user32!MessageBoxA - Module wildcards:
kernel32!*(all functions in kernel32) - Function wildcards:
*!MessageBoxA(MessageBoxA in any module. Not recommended for performance reasons, better find the module the function is in first) - Multiple symbols separated by commas:
ntdll!NtCreateFile, kernel32!CreateFileA
- Specific module and function:
-
Return Address Range (optional): Filter calls based on where they will return to
- Start Address: Beginning of return address range (hex format)
- End Address: End of return address range (hex format)
- Useful for finding calls made from specific code regions
Query Results:
The results table displays the following information for each call found:
| Column | Description |
|---|---|
| Index | Sequential index of the result |
| Event Type | Always "Call" for TTD.Calls events |
| Time Start | TTD position when the call began (format: sequence:step) |
| Time End | TTD position when the call returned |
| Function | Symbolic name of the called function |
| Function Address | Memory address of the function |
| Return Address | Address where execution will return after the call |
| Return Value | Value returned by the function (if applicable) |
| Thread ID | OS thread ID that made the call |
| Unique Thread ID | Unique thread identifier in the trace |
| Parameters | Function parameters (if available) |
Interacting with Results:
- Double-click Time Start/End: Time-travels to that position in the trace and navigates to the function address
- Double-click Function/Return Address: Navigates to that address in the disassembly view
- Right-click menu:
- Copy selected cell
- Copy entire row (tab-separated)
- Copy entire table (with headers)
- Configure column visibility
- Reset columns to default
Multi-Tab Support:
The TTD Calls widget supports multiple query tabs, allowing you to compare different call queries:
- Click the
+button in the top-right to create a new tab - Each tab maintains its own query parameters and results
- Close tabs using the
×button (at least one tab must remain open)
Example Queries
Find all MessageBox calls:
Symbols: user32!MessageBoxA, user32!MessageBoxW
Symbols: *!MessageBoxA, *!MessageBoxW
Find all ntdll system calls:
Symbols: ntdll!Nt*
Find file operations from specific module:
Symbols: kernel32!CreateFileA, kernel32!ReadFile, kernel32!WriteFile
Return Address Range: 0x400000 to 0x500000
Find all calls to a function across all modules:
Symbols: *!malloc
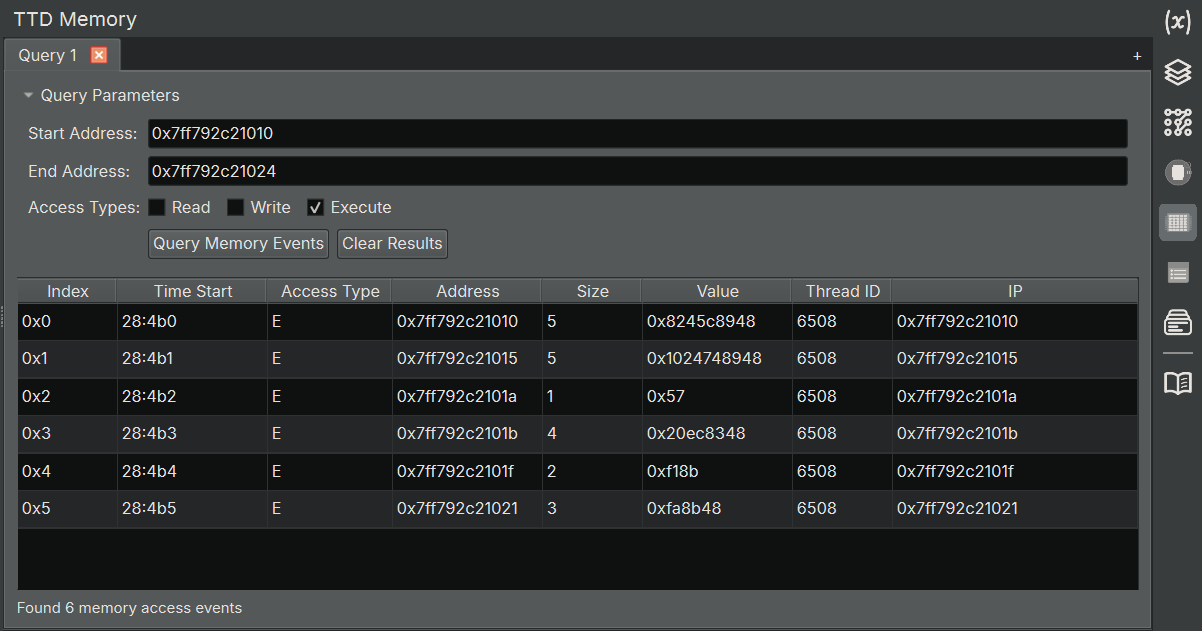
TTD Memory Widget
The TTD Memory widget allows you to query memory access events from your TTD trace. This is equivalent to WinDbg's dx @$cursession.TTD.Memory() functionality.
Accessing TTD Memory
There are several ways to open the TTD Memory sidebar:
- Click the TTD Memory button in the sidebar (hover over the icons to see its name), type in the address and check the memory access type, and click the
Query Memory Eventsbutton- Note: The TTD sidebar icons are hidden when you are not actively debugging. They will appear in the sidebar when you start a TTD debugging session.
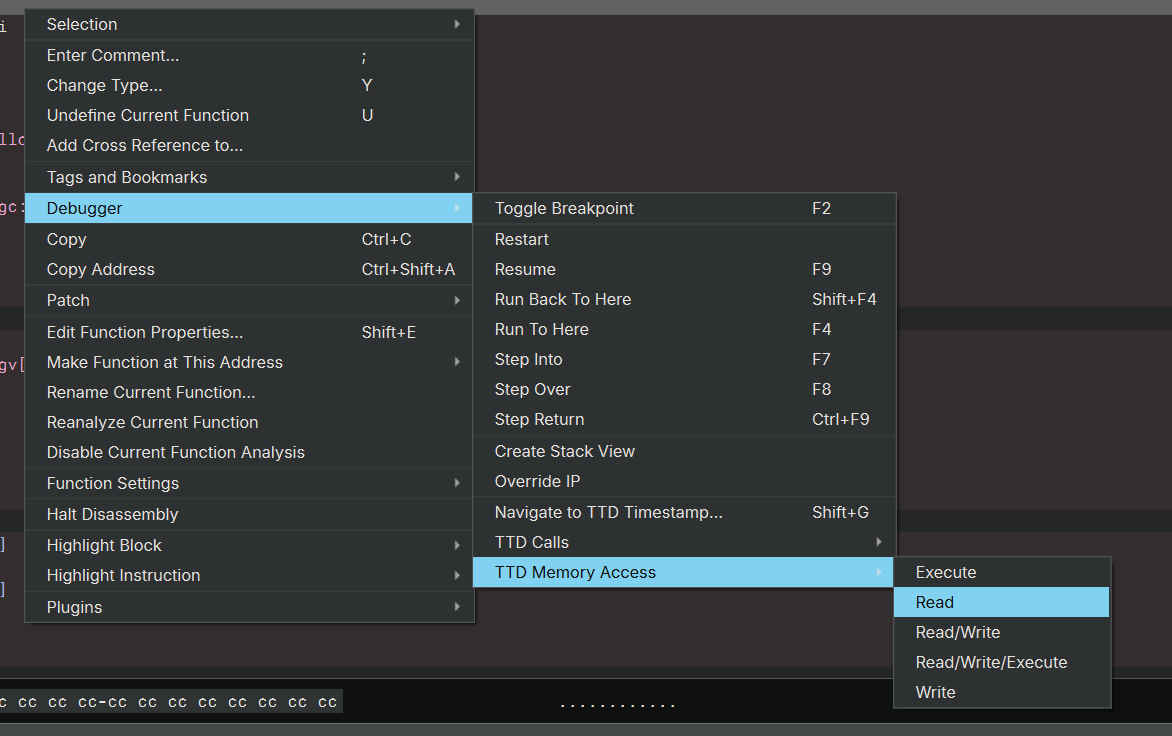
- Select a range of code or data, right-click, then select
Debugger->TTD Memory Access, and choose the specific memory access type you are interested in (Read, Write, Execute, or combinations). This will open the TTD Memory widget with the selected address range and perform the query. This is the most convenient way to use it.
The widget appears in the right sidebar by default.
Using the TTD Memory Widget
Query Parameters:
-
Address Range: The memory range to query
- Start Address: Beginning address of the memory range (hexadecimal)
- End Address: Ending address of the memory range (hexadecimal)
- Auto-populated with the binary's address range by default
-
Time Range (Optional): Filter results to a specific time window in the trace
- Start Time: Beginning TTD position (format:
sequence:stepin hexadecimal, e.g.,0:0) - End Time: Ending TTD position (format:
sequence:stepin hexadecimal, e.g.,23f:a7) - Leave blank to query the entire trace
- Start Time: Beginning TTD position (format:
-
Access Types: Select which types of memory access to include:
- Read: Memory read operations
- Write: Memory write operations
- Execute: Memory execute operations (instruction fetches)
- You can select multiple access types simultaneously
Query Results:
The results table displays the following information for each memory access event:
| Column | Description |
|---|---|
| Index | Sequential index of the result |
| Position | TTD position when the access occurred (format: sequence:step) |
| Access Type | Type of access: R (Read), W (Write), E (Execute) |
| Address | Memory address that was accessed |
| Size | Number of bytes accessed |
| Value | Data value that was read/written/executed (truncated to the access size) |
| Thread ID | OS thread ID that performed the access |
| Unique Thread ID | Unique thread identifier in the trace |
| IP | Instruction pointer (address of instruction that caused the access) |
Interacting with Results:
- Double-click Position: Time-travels to that position in the trace and navigates to the instruction that caused the access
- Double-click Address/IP: Navigates to that address in the disassembly view
- Right-click menu:
- Copy selected cell
- Copy entire row (tab-separated)
- Copy entire table (with headers)
- Configure column visibility
- Reset columns to default
Multi-Tab Support:
Like TTD Calls, the TTD Memory widget supports multiple query tabs:
- Click the
+button to create a new tab - Each tab maintains independent query parameters and results
- Close tabs using the
×button (at least one tab must remain open)
Example Queries
Find all writes to a specific variable:
Start Address: 0x00401000
End Address: 0x00401004
Access Types: Write only
Find all accesses to a memory region:
Start Address: 0x00405000
End Address: 0x00406000
Access Types: Read, Write
Track instruction execution in a function:
Start Address: 0x00401234
End Address: 0x00401456
Access Types: Execute only
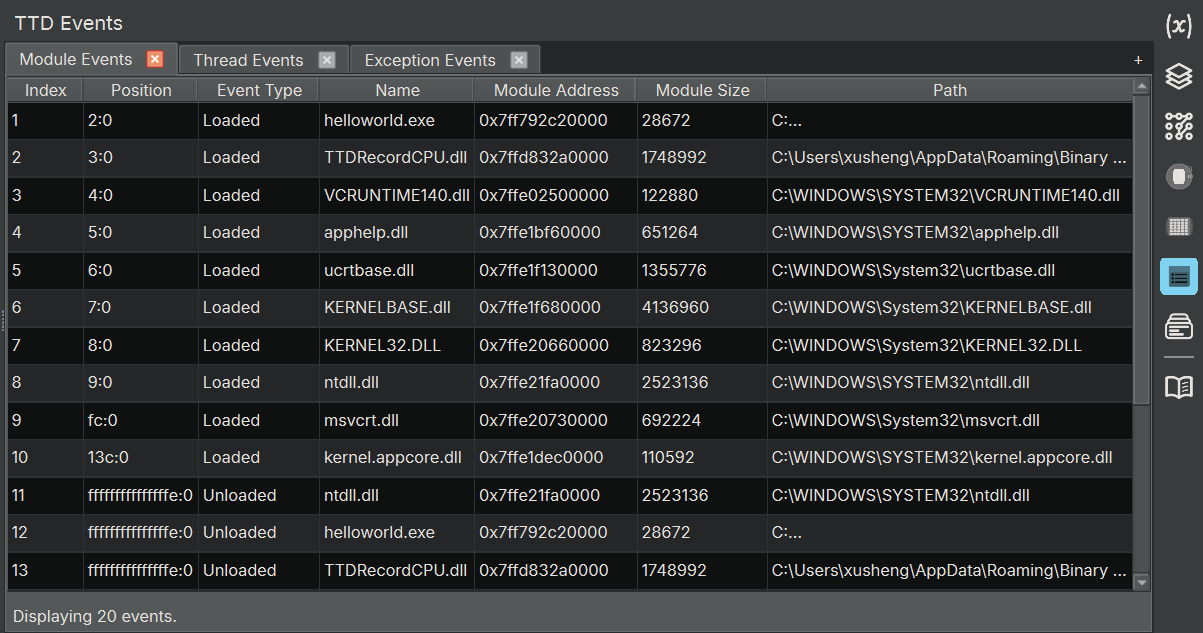
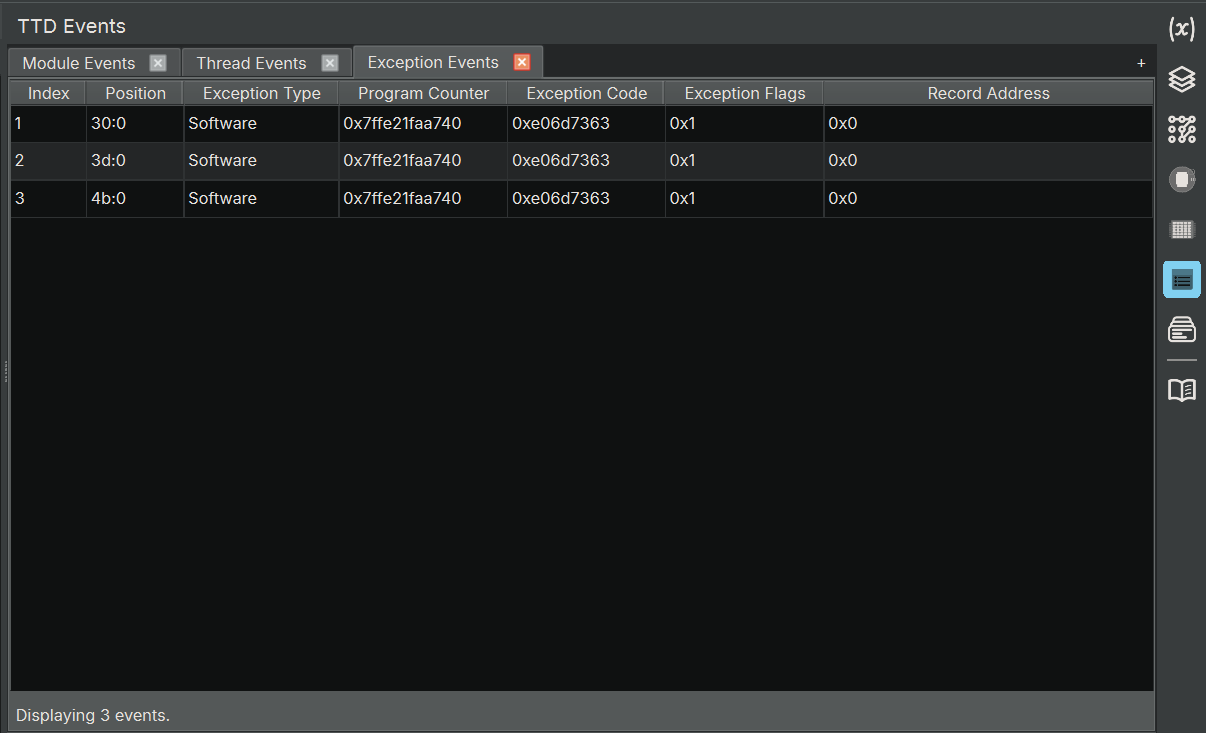
TTD Events Widget
The TTD Events widget displays important events that occurred during the TTD trace, such as thread creation/termination, module loads/unloads, and exceptions. This is equivalent to WinDbg's dx @$cursession.TTD.Events() functionality.
Accessing TTD Events
-
Open the TTD Events sidebar:
- Click the TTD Events button in the sidebar (hover over the icons to see its name)
- Note: The TTD sidebar icons are hidden when you are not actively debugging. They will appear in the sidebar when you start a TTD debugging session.
-
The widget appears in the right sidebar by default
Using the TTD Events Widget
The TTD Events widget organizes events into specialized tabs for easier analysis:
Tabs:
-
All Events: Shows all events with checkboxes to filter by type:
- Thread Created
- Thread Terminated
- Module Loaded
- Module Unloaded
- Exceptions
-
Modules: Focused view showing only module load/unload events with relevant columns
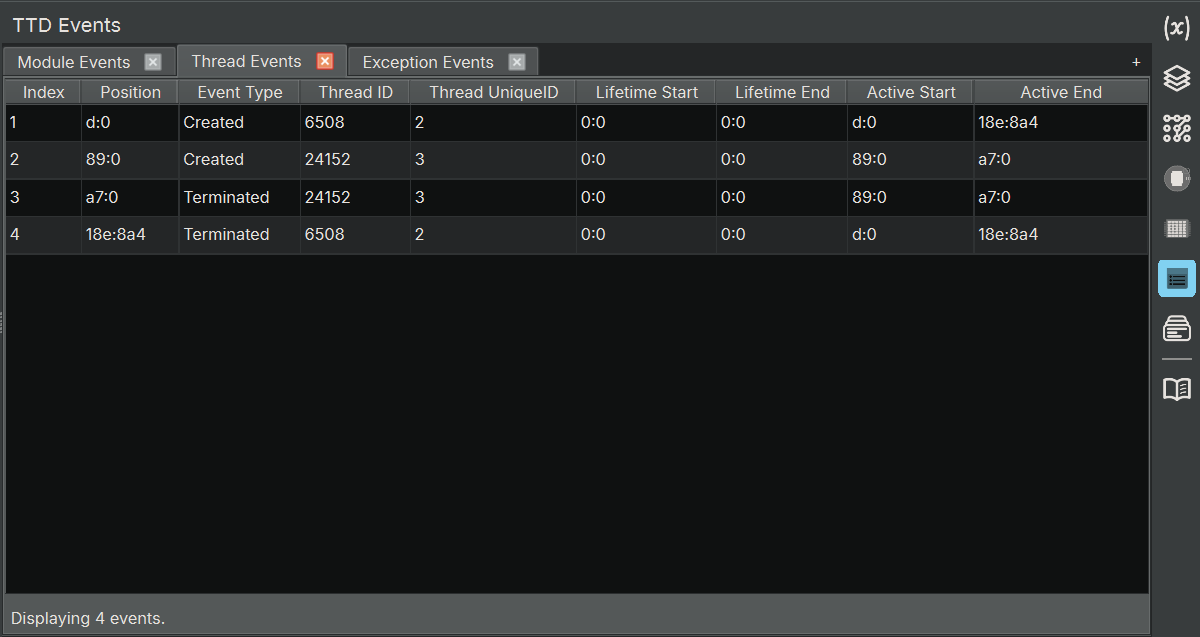
- Threads: Focused view showing only thread creation/termination events with relevant columns
- Exceptions: Focused view showing only exception events with relevant columns
Event Information:
The results table shows event-specific information:
| Column | Description |
|---|---|
| Index | Sequential index of the event |
| Event Type | Type of event (ThreadCreated, ModuleLoaded, Exception, etc.) |
| Position | TTD position when the event occurred |
| Thread ID | Thread ID associated with the event |
| Thread Unique ID | Unique thread identifier |
| Module Name | Name and path of module (for module events) |
| Module Address | Load address of module (for module events) |
| Module Size | Size of module in bytes (for module events) |
| Exception Type | Software or Hardware (for exception events) |
| Exception Code | Exception code value (for exception events) |
| Exception PC | Program counter where exception occurred (for exception events) |
Interacting with Results:
- Double-click Position: Time-travels to that position in the trace
- Double-click Module Address: Navigates to the module's load address
- Double-click Exception PC: Navigates to the address where the exception occurred
- Right-click menu: Copy functionality similar to other TTD widgets
Use Cases:
- Understanding Program Structure: See all loaded modules and their addresses
- Thread Analysis: Track thread creation and lifetime in multi-threaded applications
- Exception Debugging: Find all exceptions that occurred during execution
- Initialization Analysis: See the order in which modules were loaded
Example Workflows
Finding when a specific DLL was loaded:
- Open the TTD Events widget
- Switch to the "Modules" tab
- Sort by Module Name column
- Find the DLL in the list
- Double-click the Position to time-travel to when it was loaded
Analyzing crashes:
- Switch to the "Exceptions" tab
- Look for exception events near the end of the trace
- Double-click the Exception PC to see where the crash occurred
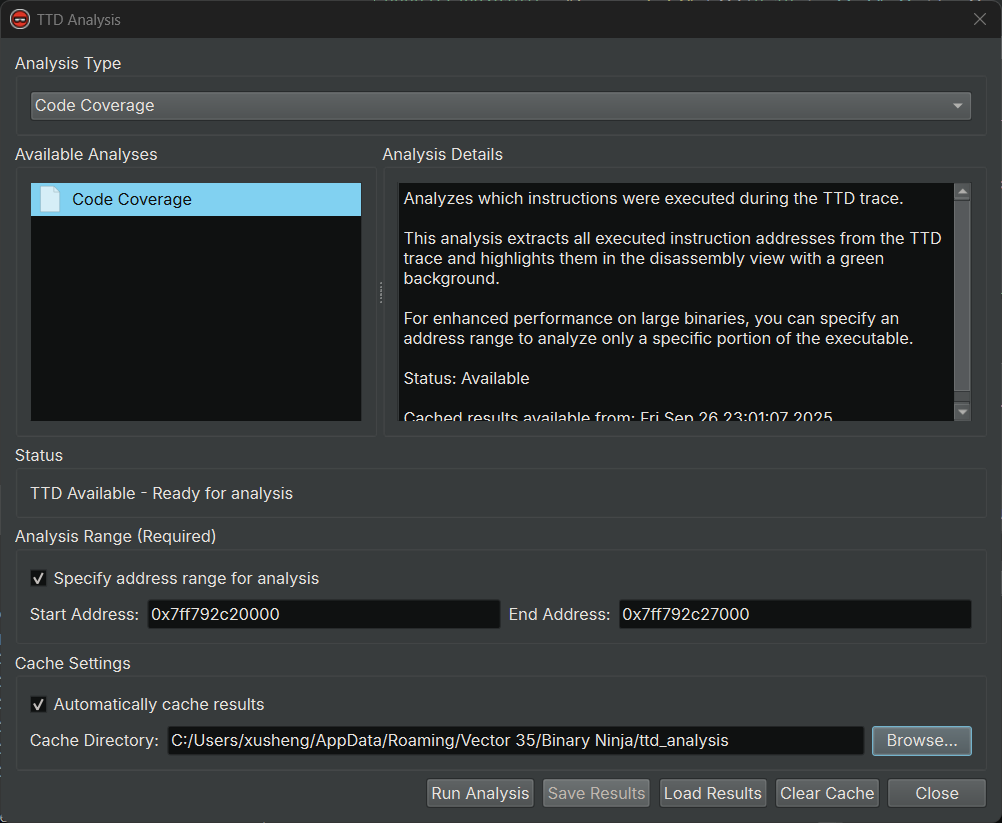
TTD Analysis Dialog
The TTD Analysis dialog provides advanced analysis capabilities for TTD traces, including code coverage analysis. This feature helps you understand which parts of the code were executed during the trace.
Accessing TTD Analysis
- Click
Debugger->TTD Analysis...when debugging a TTD trace - The dialog opens showing available analysis types
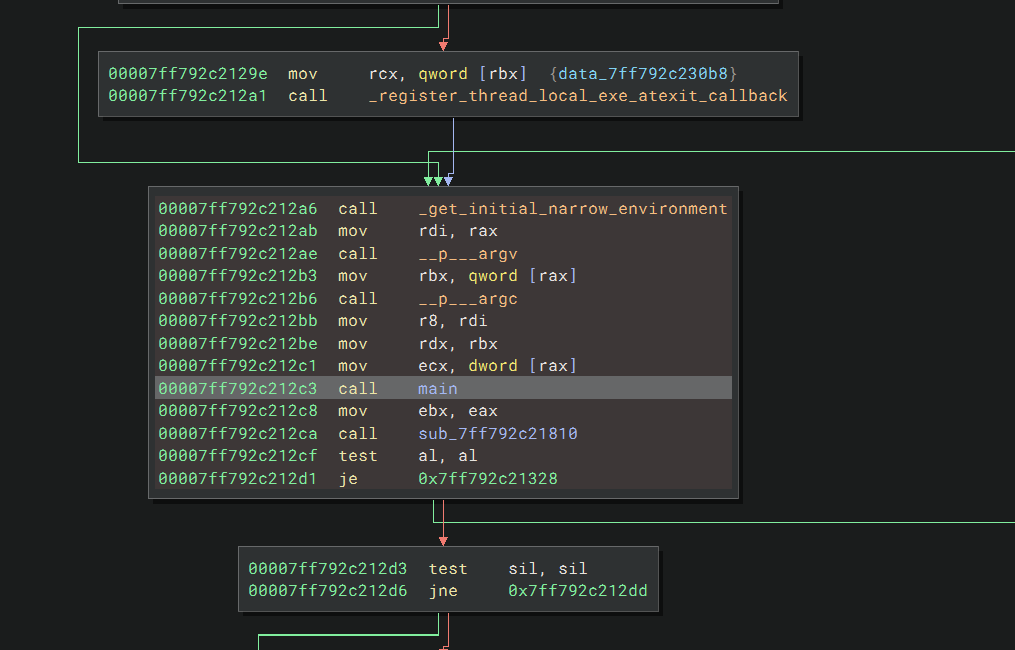
Code Coverage Analysis
Code coverage analysis identifies all instructions that were executed during the TTD trace and highlights them in the disassembly view.
Running Code Coverage Analysis:
- Open the TTD Analysis dialog
- Select "Code Coverage" from the analysis list
- (Optional) Check "Specify address range for analysis" to analyze a specific memory region
- Click "Run Analysis"
- When complete, executed instructions are highlighted in red in the disassembly view
Time Range Filter:
Code coverage analysis can be limited to a specific time range within the trace:
- Check "Specify time range for analysis" in the dialog
- Enter the start and end TTD positions (format: sequence:step, e.g.,
1A0:0to2B5:1F) - This allows you to analyze coverage for specific portions of the trace, such as:
- A specific function execution
- A particular user interaction
- The time between two breakpoints
Analysis Results:
- Executed Instructions: Highlighted with red background in the disassembly
- Execution Count: Each executed instruction shows the number of times it was executed in brackets, e.g.,
[42] - Result Count: Number of unique instructions executed is shown in the dialog
- Coverage Overlay: Visual indication of which code paths were taken
TTD Coverage Render Layer:
The TTD Coverage render layer is enabled by default. Once code coverage analysis completes, executed instructions will automatically be highlighted in red with their execution counts displayed in the disassembly view.
If the highlighting is not visible, you can manually enable the render layer:
- Right-click in the disassembly view
- Select
Render Layersfrom the context menu - Check
TTD Coverageto enable the render layer
Caching:
Code coverage analysis results can be cached for faster loading:
- Auto-cache: Enable "Automatically cache results" to save automatically
- Manual Save: Click "Save Results" to save the analysis to a file
- Manual Load: Click "Load Results" to restore a previously saved analysis
- Clear Cache: Remove all cached analysis files
Cache files are stored as:
- Metadata:
.jsonfile containing analysis information - Data:
.datafile containing executed instruction addresses
Performance Considerations:
- Code coverage analysis can take minutes or even longer on large traces
- The analysis queries all execute instructions across the entire trace
- Results are cached to avoid re-running expensive queries
- Use address ranges to limit analysis to specific modules or functions
Use Cases:
- Understanding Execution Flow: See which code paths were executed
- Finding Dead Code: Identify code that was never executed during the trace
- Coverage Analysis: Measure test coverage or fuzzing effectiveness
- Hot Path Identification: Focus on frequently executed code sections
Tips and Best Practices
Performance Considerations:
⚠️ Important: All TTD queries (Calls, Memory, Events) execute synchronously and block the Binary Ninja UI until they complete. There is currently no way to interrupt a running query due to a WinDbg backend limitation. Long-running queries on large traces can cause the UI to appear frozen for several minutes.
To minimize query time:
- Start with specific, narrow queries rather than broad searches
- For TTD Calls: Use specific module!function combinations instead of wildcards like
*!* - For TTD Memory: Limit address ranges to the specific regions you need
- For memory queries, be especially careful with large address ranges - querying an entire module can be very slow
- Use execute access queries for code coverage analysis
- Test with small ranges first, then expand as needed
Workflow Recommendations:
- Understanding Program Flow: Use TTD Calls to identify all invocations of important functions
- Data Flow Analysis: Use TTD Memory to track when specific variables or buffers are accessed
- Root Cause Analysis: Double-click on events to time-travel to the exact moment of interest
Column Visibility:
Both widgets allow customization of which columns to display:
- Right-click in the table and select "Column Visibility..."
- Hide less relevant columns to focus on important data
- Use "Reset Columns to Default" to restore the default view
Python API for TTD
In addition to the UI widgets, Binary Ninja provides a comprehensive Python API for programmatic access to TTD functionality. This allows you to:
- Write custom analysis scripts
- Automate TTD queries
- Build advanced analysis tools
- Export TTD data for external processing
For complete API documentation, see TTD Python API.
Quick Example:
# Get the debugger controller
dbg = binaryninja.debugger.DebuggerController.get_controller(bv)

# Check if TTD is available
if dbg.is_ttd:
    # Query all calls to a function (requires module name)
    calls = dbg.get_ttd_calls_for_symbols("user32!MessageBoxA")
    print(f"Found {len(calls)} calls to MessageBoxA")

    # Query memory writes to an address range
    events = dbg.get_ttd_memory_access_for_address(0x401000, 0x401004, "w")
    print(f"Found {len(events)} writes to 0x401000-0x401004")
Additional Resources
For more TTD-related tools, scripts, and resources, check out Awesome TTD - a curated list of TTD resources maintained by the community.
Feedback and Suggestions
The debugger is open-source and we have a public issue repository for it: https://github.com/Vector35/debugger/issues/. Please feel free to file bug reports and request new features, either specifically for TTD or more generally for the debugger. Or even better, join our public Slack and talk to the developers and users!