Windows Kernel Debugging
Binary Ninja debugger supports windows kernel debugging, either remote debugging using two machines, or local kernel debugging. Below is the steps to configure it.
Remote Kernel Debugging
At a high level, doing remote kernel debugging involves two steps: 1). setting up kernel debugging, 2). in Binary Ninja, use the connection string to connect to it. There are multiple ways to configure Windows kernel debugging, and we will use kdnet as as example. Other configurations should be similar.
- Setting up kernel debugging following the official documentation. Below is a quick recap:
- Copy
kdnet.exeandVerifiedNICList.xmlto the guest machine - Find out the host machine IP address and an available port
- Ensure the network communication between the host and guest is smooth (e.g., check firewall settings)
- On the guest machine, run
kdnet.exe <host_IP> <Port>with administrative privilege, e.g.,kdnet.exe 192.168.56.1 50000 kdnetwill print out a windbg command line which contains the connection string, e.g.,windbg -k net:port=50000,key=m94cdr7mkd1g.2kr136s4s2gjn.g4fjk4arnn69.zjgk4tc396li. Copy this to the host machine
- Copy
-
Start up kernel debugging in Binary Ninja
- Depending on your usage:
- If you wish to debug code in a specific driver, open the file in Binary Ninja and analyze it, or
- If you wish to debug the kernel in general, do not open any file, and create a new mapped data by Clicking "File" -> "New Mapped Data", and set the architecture/platform accordingly, e.g., to
windows-kernel-x86_64
- Open the
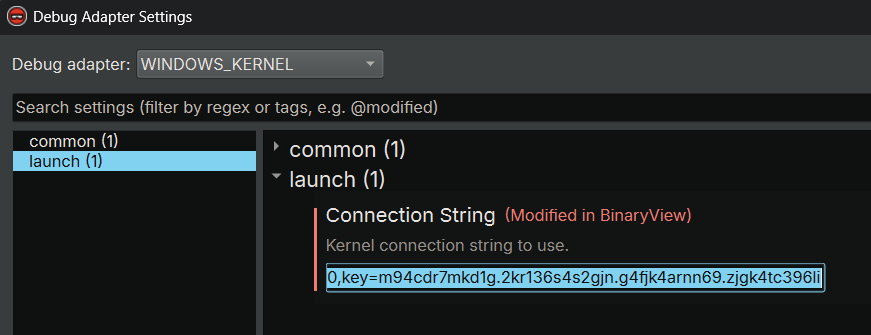
Debug Adapter Settingsdialog
- Select
WINDOWS_KERNELas the adapter type - Set
Connection Stringto the kernel debugging connection string, e.g,net:port=50000,key=m94cdr7mkd1g.2kr136s4s2gjn.g4fjk4arnn69.zjgk4tc396li. Note, do not include thewindbg -kpart in it. - Click
Accept - Click the
Launchbutton to start kernel debugging - The debugger asks you to confirm the launch operation. Click
Yesto proceed - If you did not open a file in the first step, the debugger asks you to specify the platform for the debugger binary view. Select
windows-kernel-x86_64orwindows-kernel-x86accordingly. ClickAcceptto proceed - The debugger will now connect to the guest machine. In the
Debugger Console, it should print something similar to this:Microsoft (R) Windows Debugger Version 10.0.22621.1 AMD64 Copyright (c) Microsoft Corporation. All rights reserved. Using NET for debugging Opened WinSock 2.0 Waiting to reconnect...
- Depending on your usage:
-
Finalizing the setup
- Reboot the guest machine by running
shutdown -r -t 0in the guest command prompt - The guest machine will then reboot and connect to the debugger
- We will see somethng similar to this in the
Debugger Consolein Binary Ninja:
Connected to target 192.168.56.1 on port 50000 on local IP 192.168.56.1. ...... System Uptime: 0 days 0:00:02.433 Break instruction exception - code 80000003 (first chance) ******************************************************************************* * * * You are seeing this message because you pressed either * * CTRL+C (if you run console kernel debugger) or, * * CTRL+BREAK (if you run GUI kernel debugger), * * on your debugger machine's keyboard. * * * * THIS IS NOT A BUG OR A SYSTEM CRASH * * * * If you did not intend to break into the debugger, press the "g" key, then * * press the "Enter" key now. This message might immediately reappear. If it * * does, press "g" and "Enter" again. * * * *******************************************************************************- Wait for a short while for the guest to boot, and it will break into the debugger:
Break instruction exception - code 80000003 (first chance) nt!KiInitializeMTRR+0x36512: fffff801`7e281e36 cc int 3- (Optional) If you wish to debug the early boot phase, place the appropriate breakpoint(s) using the WinDbg command line in the console
- Press the
Gobutton in the debugger sidebar or typegin the debugger console to resume the target - The guest should continue to boot and enter the desktop
- This might be slower compared to a regular boot process since the system is being debugged
- During this process, the guest may break into the debugger a few more times. This is normal for kernel debugging. Just resume the target and let it run
- If you have opened a driver file earlier, when it gets load, the debugger breaks at its
DriverEntry - If you did not open a driver file, once the guest boots into the desktop, click the
Pausebutton to break into the debugger - Proceed with the debugging as you would like to!
- Reboot the guest machine by running
Local Kernel Debugging
- Run Binary Ninja with administrative privilege
- Create a new empty binary view by pressing Ctrl+N/Command+N
- Open debugger sidebar, click
Debug Adapter Settings - Select
LOCAL_WINDOWS_KERNELas the adapter type. ClickAccept - Click the
Launchbutton to start local kernel debugging - The
Debugger Consoleshould print something similar to this:Microsoft (R) Windows Debugger Version 10.0.22621.1 AMD64 Copyright (c) Microsoft Corporation. All rights reserved. Connected to Windows 10 22621 x64 target at (Fri Jan 26 14:01:59.297 2024 (UTC + 8:00)), ptr64 TRUE Symbol search path is: srv* Executable search path is: Windows 10 Kernel Version 22621 MP (24 procs) Free x64 Product: WinNt, suite: TerminalServer SingleUserTS Edition build lab: 22621.1.amd64fre.ni_release.220506-1250 Machine Name: Kernel base = 0xfffff805`51400000 PsLoadedModuleList = 0xfffff805`520134a0 Debug session time: Fri Jan 26 14:01:59.511 2024 (UTC + 8:00) System Uptime: 0 days 21:40:55.173 - Proceed with the debugging as you would like to!
Troubleshooting & Known Issues
- Running certain commands that takes a while to complete can lead to a brief hang
- When we end the remote kernel debugging, the guest system is always paused
- Once we have enabled kernel debugging with
kdnet, the system will always wait for a kernel debugger to connect during boot. It would hang if we do not attach a kernel debugger, even if we do not plan to do kernel debugging at all. To avoid this, I highly recommend taking a snapshot of the VM before attempting to do kernel debugging. If you know there is a way to reset the kernel debugging status and let the system boot in the normal way, please let me know!
